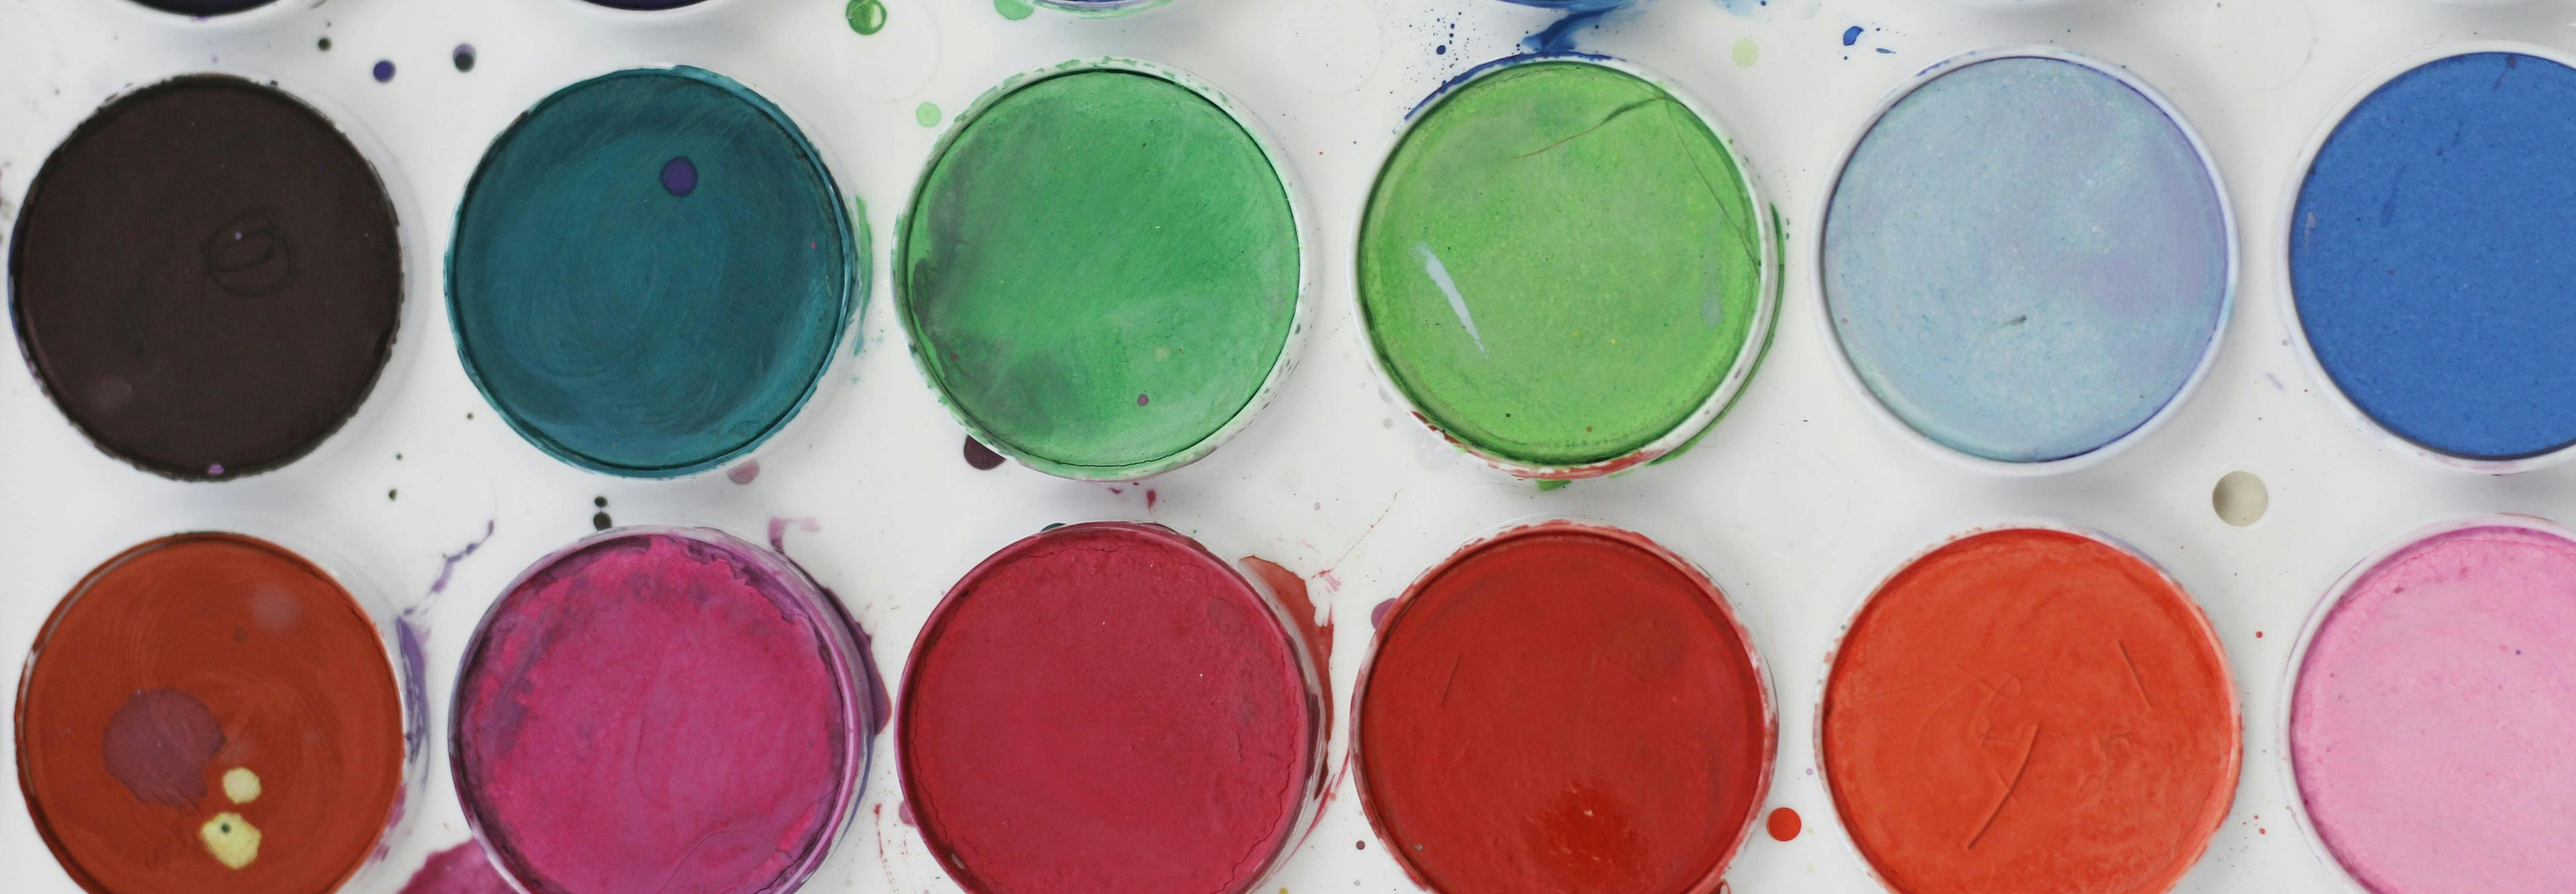
At Strata, we often have to create apps from scratch, and one of the major challenges is creating a usable and accessible colour palette. You’ve probably had the experience of painting a room and being disappointed at how it turned out. “Painting” a user interface is no different – there can be a lot of trial-and-error!
Why? Because colour is hard!
Even for good designers. 😉
Want proof that colour is hard? We are now at about nine different ways of modelling colour. You’ve heard of RGB, but what about CIECAM02?
"The CIE's most recent model, CIECAM02 (CAM stands for 'color appearance model'), is more theoretically sophisticated and computationally complex than earlier models. Its aims are to fix several of the problems with models such as CIELAB and CIELUV, and to explain not only responses in carefully controlled experimental environments, but also to model the color appearance of real-world scenes. Its dimensions J (lightness), C (chroma), and h (hue) define a polar-coordinate geometry." (Wikipedia)
The essential problem is that colour is subjective and depends on so many factors (screen vs. paper, lighting conditions, display technology, context and culture). Colour looks like a math problem, and math can be helpful, but as with many things in life, there is a lot of grey area (see what I did there?). Plus, we designers shouldn’t be afraid to trust our eyes!
When creating a palette for an app or website interface, we need just one or two brand or theme colours, a few utility colours (error, success, warning), and a lot of grey. As Adam Wathan and Steve Schoger have shown, multiple theme colours that look good together do not necessarily translate into a clean user interface. A single brand colour works best – and multiple variations of that colour – in addition to your utility colours.

From Building Your Color Palette – Refactoring UI
First of all, RGB is only useful to computers, not to humans. HSL and HSB (hue, saturation, and lightness or brightness) are more intuitive models. But even they fall short when developing pleasing shades and tints of your brand colour, because it’s not as simple as adjusting brightness while keeping the hue and saturation constant.
In real life, our perception of colour follows an interesting pattern, as I learned from Erik Kennedy. As brightness goes down, saturation goes up, and vice versa. Hue also changes with brightness – but sometimes it goes up and sometimes down!
Take a look at this photo of some kids at a playground. I sampled two colours reflecting the sunlight and the same colours in the shadows – the green paint on the merry-go-round and the orange stripe on the girl’s shirt.

Comparing HSB values in natural light and shadow. Photo credit: Wes Reimer
Brightness goes down in the shadows (obviously), but saturation goes up – a consistent pattern for both colours. But notice that hue shifts in opposite directions – it increases for the green but decreases for the orange!
The reason for this is that we naturally perceive some hues to be darker than others – even when brightness and saturation remain constant in the HSB model. This perceived brightness is called luminosity or luminance.
Take a look at this wheel of hue values from zero to 360 degrees in 30-degree increments. The inner half of each circle shows its luminosity. The brightness and saturation of each circle is 100%.

Notice that the darkest hues in each third are the “pure” red, green and blue values, while the lightest are the yellow, cyan and magenta.
The takeaway here is that if you want a more natural way to darken a key colour, increase its saturation and/or shift its hue towards the closest red, green or blue value – and do the opposite to lighten – in addition to adjusting the lightness.
Taking the colours from the photo as examples, the peachy orange hue is 24, and since that is closer to zero than it is to 120 or 240, we decrease its value towards red. The green hue is 122, which is closer to 240 than it is to 0, and so we increase its value towards blue. (Yes, the green is almost exactly 120, so it could equally gain darkness in the other direction – a matter of whether you prefer the warmer or cooler green.)
These are guidelines, not rules – colours in real life tend to follow these patterns, but not always. Experiment and trust your eyes!
The holy grail of UI palettes is one with consistently scaled, numbered colours – where each number represents the same luminosity regardless of hue and saturation. This makes it easy to swap colours while maintaining the same contrast ratios. Adequate contrast is essential for a usable, legible, accessible interface. This type of system also helps with the creation of a dark mode for your UI.
Creating such a palette is not feasible in Figma and other apps that only support the most common colour spaces, because there is no way to specify luminosity (perceived lightness). But other tools can help.
Start with an existing framework or design system, such as Tailwind or Untitled UI. These folks have done the hard work of developing useful and pleasing palettes. Sometimes all that is needed is to add a custom brand colour, but the challenge is to keep the luminosity consistent as you add each shade or tint.

To test for consistency, use a blend mode or a colour blindness simulator like Sim Daltonism (shown in the screenshot above). Or in Figma, apply the ‘Luminosity’ mode to any layer that is on a white background OR place a black rectangle on top and apply the ‘Color’ mode.

The three most useful tools I’ve found for generating and adjusting palettes are Adobe’s Leonardo, GitHub’s Primer Prism, and Alexey Ardov’s Huetone. These can be buggy and none is being actively developed at the time of this writing, but all are powerful nonetheless.
Prism helps you see how unpredictable saturation can be. Compare the included green and purple scales, which have consistent luminosity (the green is slightly darker). The lightness and hue lines follow an expected pattern, but saturation is wild – and yet these scales look great. Probably a case of a designer trusting their eyes!

Comparing HSL curves in Primer Prism
Let’s take a look at how you could match a new brand or theme colour to an existing scale in Figma by way of Huetone. You would follow a similar process in the other two tools. (Note that Prism does not have a way to match luminosity perfectly, though you can copy lightness curves from one scale to another.)
1. In Figma, use a plugin to extract the hex codes of the scale you want to match (unless you don’t mind doing it manually). Plugins like Tokens Studio, variables2css, or Global Style to Code can help, though you will still have to edit the output. You only need one target scale – for this example, I chose the “Moss” colour in Untitled UI.

2. Use a text editor to put the list of hex codes into the expected format. The format is shown in the import/export box at the bottom left in Huetone – copy this and create a new version, substituting your target scale colours, names and numbers.

3. Paste the new JSON code into the box in Huetone. You should now see your imported scale in the top left.
4. Duplicate the row by typing ⌘ + ⇧ + ↑ (Command/Ctrl + Shift + Down or Up Arrow).
5. Select one of the squares and enter the hex code of the key colour you want to add. It doesn’t matter which square you select – we will fix the luminance later. The place to enter the hex value is at the top in the middle. In this example, I added a blue.

6. Click the “…” button and select “Apply current hue to row.” (Note: in my testing, this didn’t always work. You may need to duplicate to another row and try again.)

7. The number inside the square is the APCA contrast value when that colour is used on a white background, and these won’t always be an exact match down the columns. Notice that square #600, where I added the new colour, shows a contrast of 80. In order to match the luminosity of the target colour (75), click that colour – in this case, square 600 in the “Moss” row – and select “Apply current luminance to column.” To test for uniform luminance, hold the B key down to see the colours in greyscale:

8. Now you can export the colours to use as needed. If Huetone’s native format is useful, copy that from the box at the bottom left, or click the buttons to export to Figma Tokens or CSS format.

And there you have it – a small part of the UX design process we use at Strata! I hope you have a new appreciation for the wonders and complexities of colour, along with some new ideas and tools to try.
Wes Reimer is a senior product designer at Strata Research.